Emergency Department Clinical Documentation Quality Dashboard
Analytics dashboard identifying documentation gaps to improve coding accuracy, reduce revenue leakage, and enhance compliance across 1,200+ ED encounters.
The dashboard analyzes Emergency Department documentation completeness, provider variation, coding downgrade patterns, and chart signing timeliness to help clinical and revenue cycle leaders identify operational improvement opportunities.
Business Context
Emergency Departments generate high-volume, time-sensitive clinical documentation that directly impacts patient care continuity, coding accuracy, billing compliance, and downstream revenue. However, many EDs face documentation challenges such as incomplete exam components, delayed chart closure, missing timestamps, and variability in documentation quality among providers.
These gaps reduce documentation integrity, increase denials, delay revenue cycle processes, and create compliance risks. This project focuses on building a dashboard that allows clinical leaders to monitor documentation quality, identify provider-level trends, and target workflow or education interventions.
Data
Dataset Summary
Dataset Name
ED Documentation Quality Dataset
Total Records
1,247 encounters
Total Columns
18
Date Range
2024-01-01 to 2024-03-31
Data Tables
ed_encounters
1,247 rowsPrimary encounter table containing visit details, timestamps, provider assignments, documentation completeness flags, and coding information.
Key Columns:
provider_master
47 rowsProvider reference table with provider details including name, role, group assignment, and hire date.
Key Columns:
coding_audit
1,247 rowsCoding accuracy audit table tracking expected vs billed E/M (Evaluation and Management) levels, downgrade reasons, and audit flags.
Key Columns:
Entity Relationship Diagram
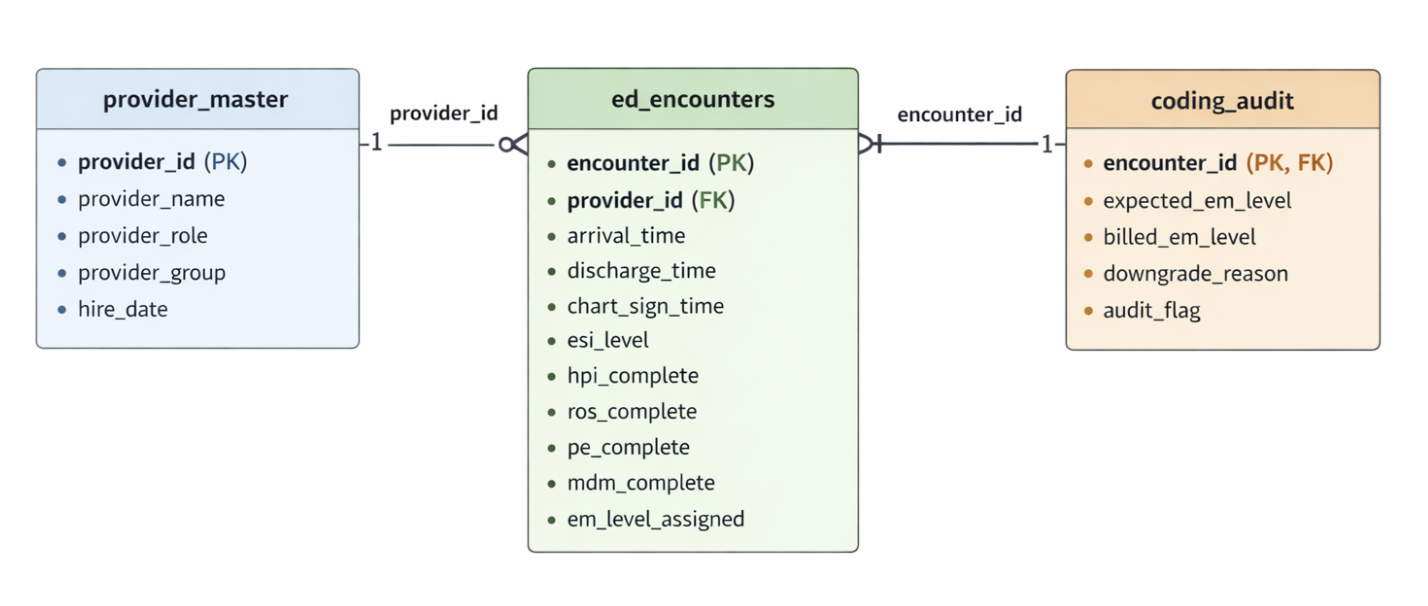
Entity Relationship Diagram showing relationships between encounters, providers, and coding audit tables. Primary keys and foreign key relationships are indicated.
SQL + Tableau Analysis
SQL Analysis Highlights
Tableau Dashboard

Key Performance Indicators
Interactive Filters
- •ESI Level
- •Provider Group
- •Shift
- •Date Range
From SQL Metrics to Operational Action
Every Tableau visualization is driven by reproducible SQLite queries that transform encounter-level data into operational insights.
- •KPI aggregation enables real-time monitoring of documentation quality and downgrade risk.
- •Provider-level analytics surface performance variability for targeted support.
- •Timeliness modeling links workflow delays to measurable quality impact.
- •E/M alignment analysis quantifies revenue integrity exposure.
- •Risk scoring logic converts analytics into an actionable CDI review queue.
Insights & Recommendations
Key Insights
20% of ED charts are closed after 24 hours, with night-shift providers showing 35% higher delays.
Delayed chart closure impacts revenue cycle, delays billing, and creates compliance risks. Night-shift providers may need workflow support or documentation templates.
Charts with incomplete MDM documentation show a 15-22% higher rate of coding downgrades.
Incomplete MDM reasoning directly correlates with lower E/M (Evaluation and Management) levels, reducing revenue capture. Targeted training on MDM documentation can improve coding accuracy.
12% of charts are missing at least one required physical exam system, with higher rates for high-acuity (ESI 1-2) patients.
Missing PE components for high-acuity patients creates compliance and quality risks. This may indicate workflow pressure or documentation template gaps.
Recommendations
Implement targeted MDM documentation training for providers with <80% completeness scores
Impact: Reduce coding downgrades by 15-20% and improve revenue capture
Create shift-specific documentation workflows and templates for night-shift providers
Impact: Improve chart completion within 24 hours by 25% and reduce delayed closure rates
Develop automated alerts for high-acuity charts missing required PE components
Impact: Improve chart completeness for ESI 1-2 patients and reduce compliance risks
SQL Library
A collection of SQLite-compatible queries used in this dashboard. Search and filter to find specific analyses.